Real-time dashboards and KPIs
Active power, energy produced, irradiance, Performance Ratio and availability. Configurable layout for asset managers, O&M managers and portfolio owners.

SunGuard Cloud
A single proprietary application to govern the plant: KPI dashboard, alarms, reports, commands, history. Multi-asset, accessible from a browser. Hardware and software belong to the same project.
Portfolio
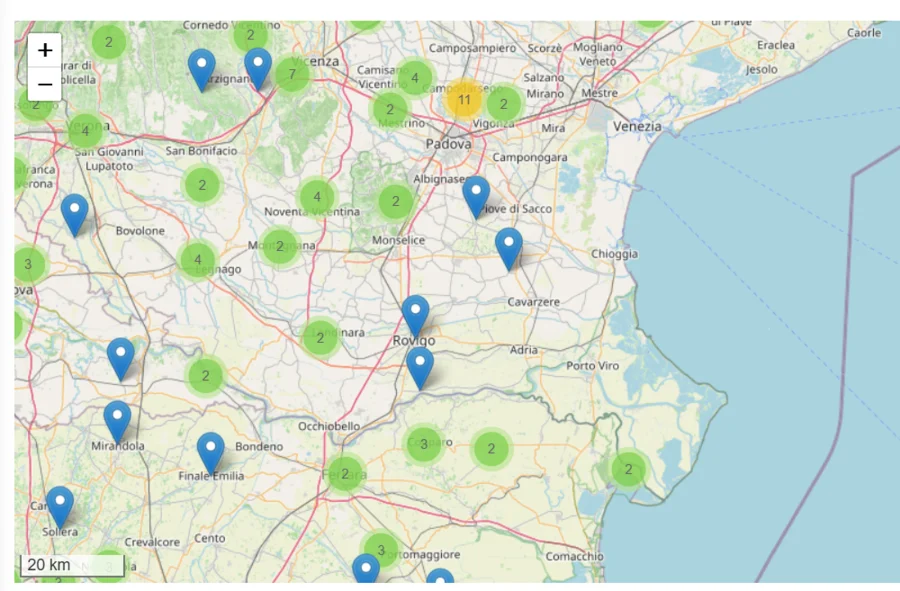
Portfolio view — plants monitored in Italy
Overview
Geographic view of all monitored plants, with real-time status. A click on the asset opens the detail: current production, active alarms, historical KPIs and environmental conditions.
Multi-client support for operators with portfolios distributed across multiple sites and countries. From the map you drill down to inverter, string and sensor.
Functions
Active power, energy produced, irradiance, Performance Ratio and availability. Configurable layout for asset managers, O&M managers and portfolio owners.
Anomaly detection on every acquisition channel. Alerts are classified by severity, validated by the Operations Center and notified to the point of contact with an estimate of energy lost and operational guidance. Escalation configurable by SLA and time slot.
Automatic periodic reports: Performance Ratio, specific yield, energy availability, comparison with expected yield. Export in PDF and Excel. For post-incentive plants, deviation analysis and revamping support.
REST API and webhooks to ERP, ITSM (ServiceNow), CMMS and asset management platforms. Multi-role access, TLS transmission, multi-factor authentication, backup and redundancy.
Inside the plant
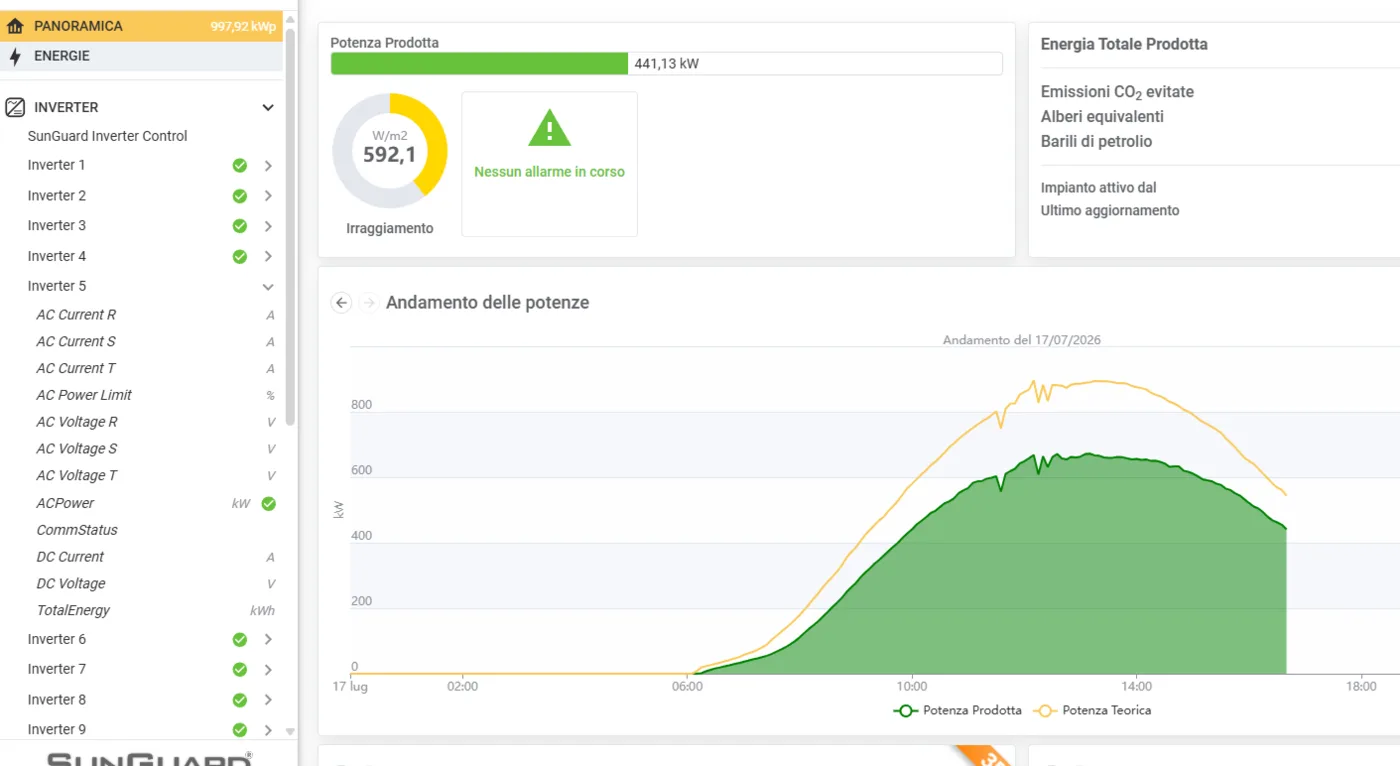
Plant overview — power produced, alarms and the day's trend
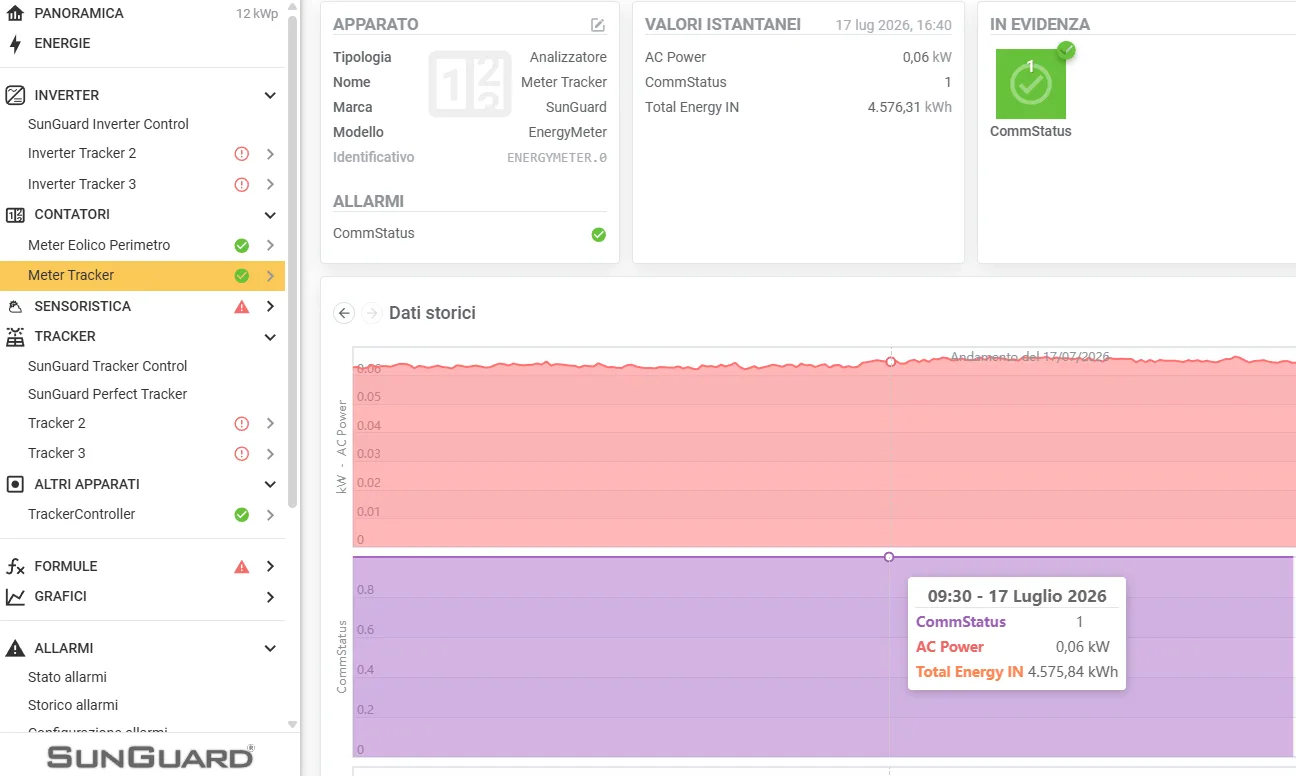
Device detail — instantaneous values, alarms and historical data of each device
Reporting and analysis
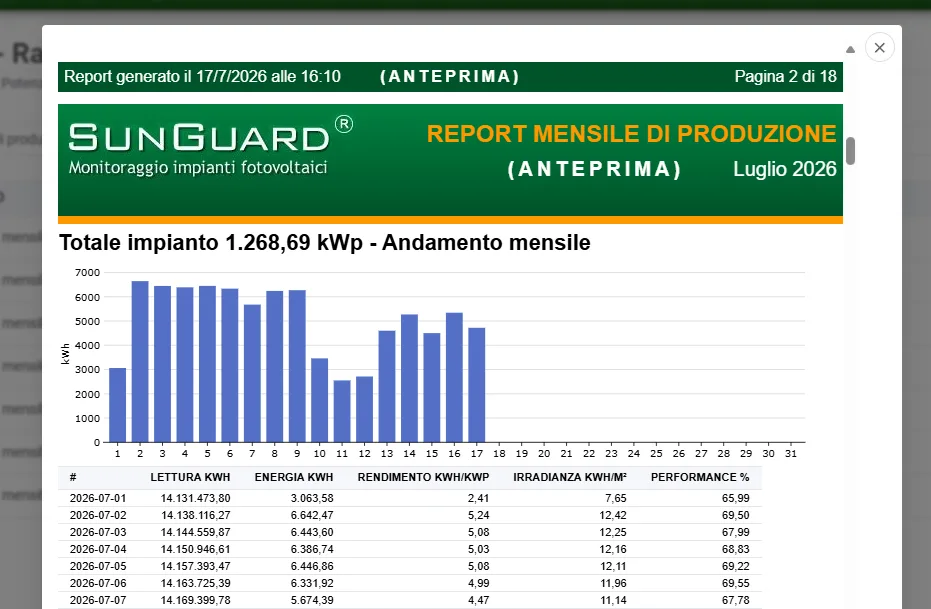
Monthly production report — automatic PDF with readings, yield and performance
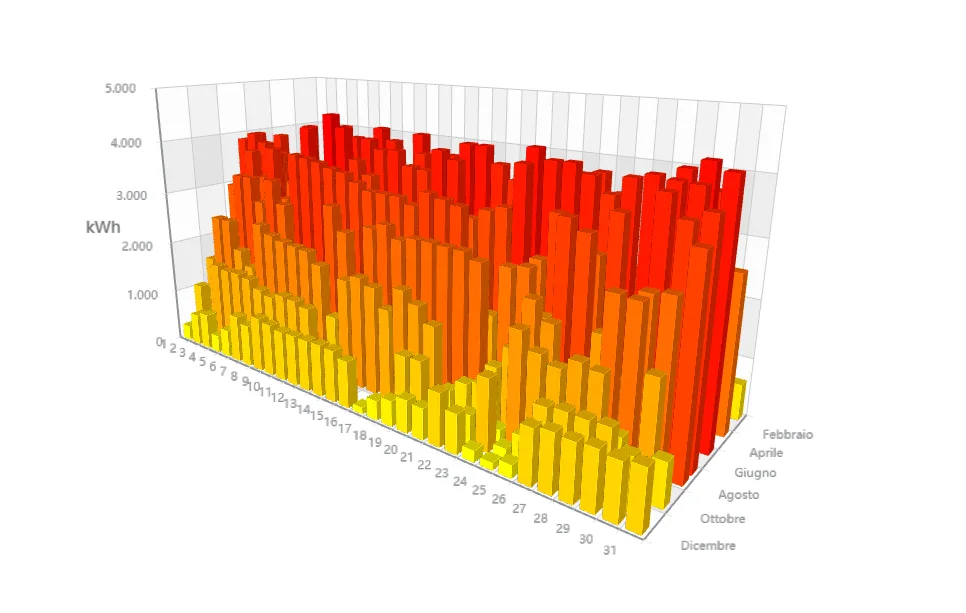
Energy trend — 3D view by month and day
Control
Operational
Inverter control: power limitation, start/stop and set-point on supported inverters, executed remotely, tracked and verified.
String control: currents from field boxes, imbalances and out-of-service strings identified before they affect production. Performance Ratio calculated continuously. Tracker: actual position versus target, with the day's timeline.
Monitoring station
Instantaneous power, operational status and complete history. In the event of an anomaly, escalation is triggered towards the NOC in compliance with contractual SLAs.
Real-time control
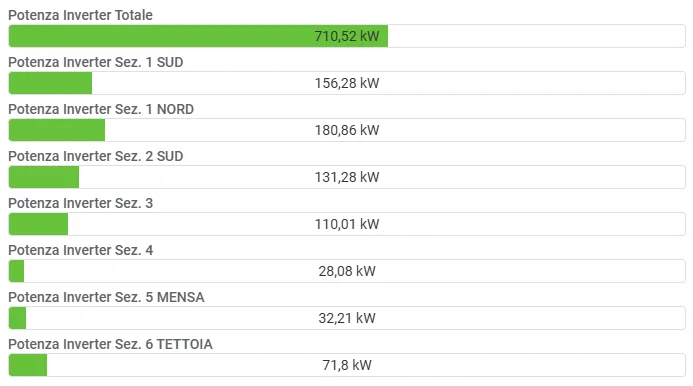
Instantaneous power — plant total and breakdown by section
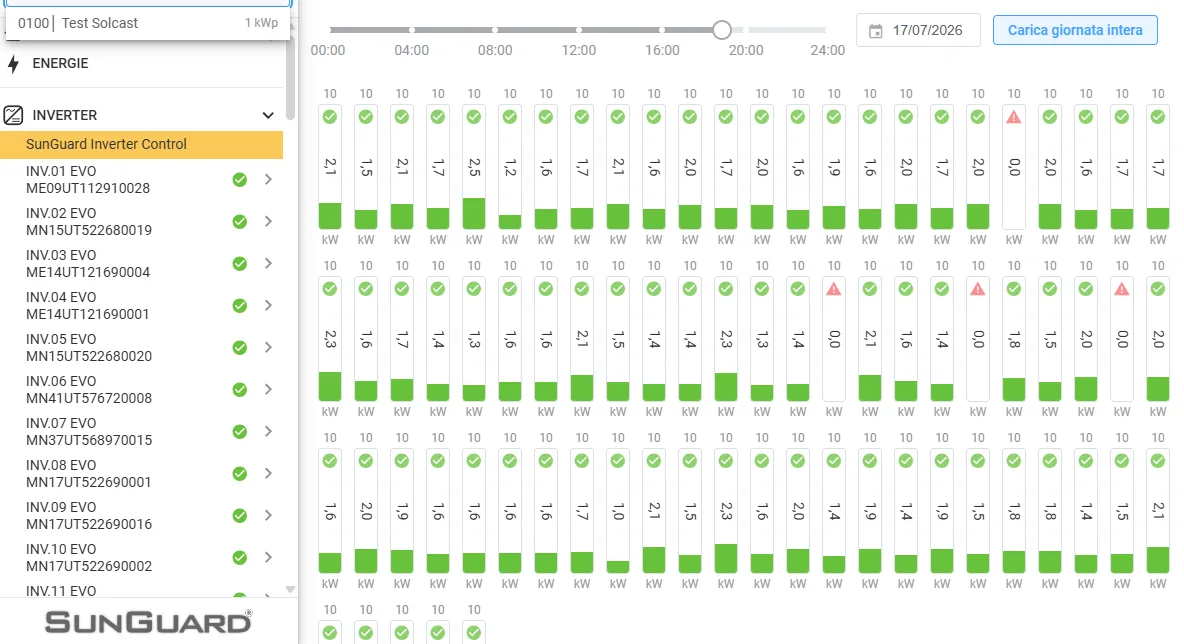
SunGuard Inverter Control — all the plant's inverters, with the day's timeline
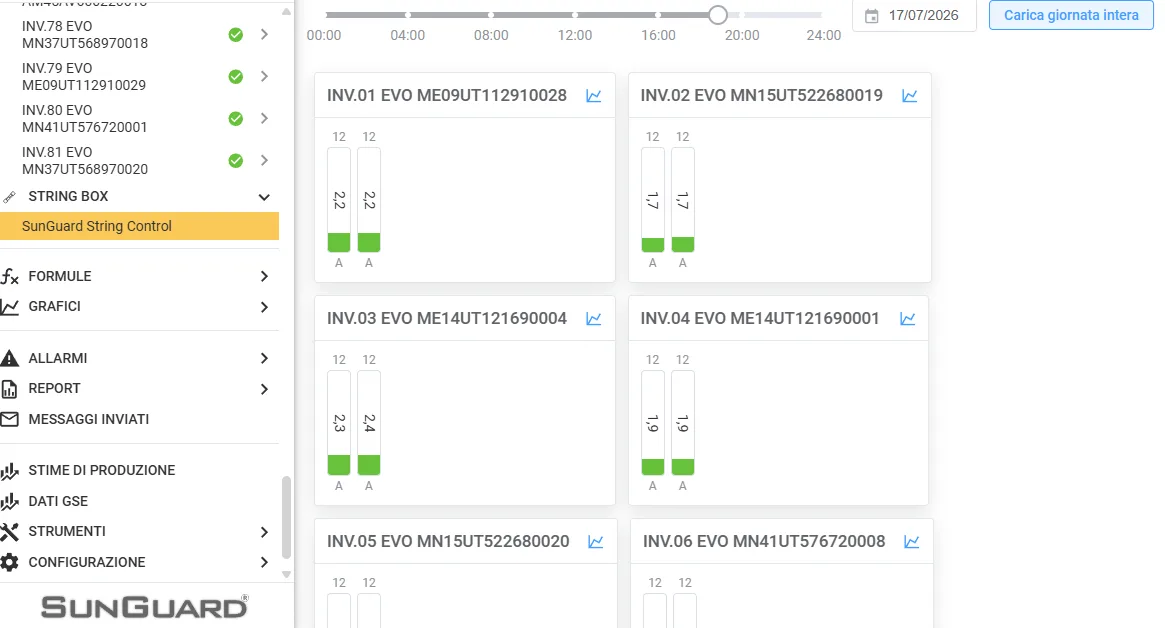
String Control — the strings of each inverter, at a glance
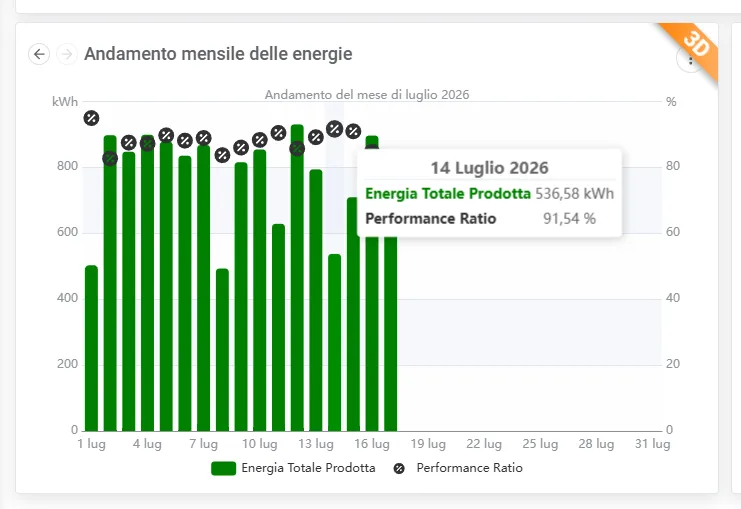
Performance — daily energy and Performance Ratio
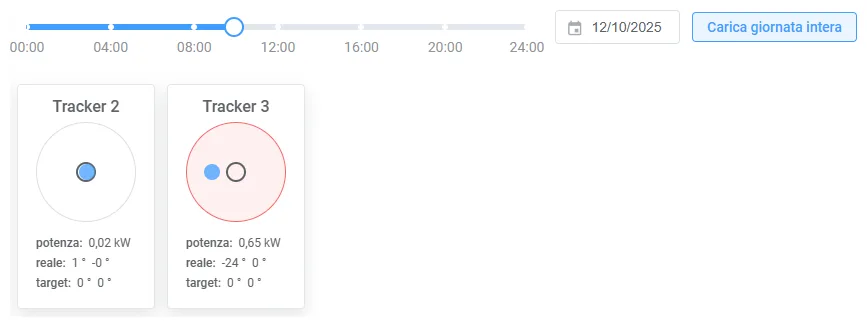
Tracker — actual position vs target, with the day's timeline
Visibility
SunGuard displays highlight instantaneous production, the day's energy, environmental contribution and service status. Indoor and outdoor, powered by the platform: the same operational truth the NOC sees, made readable for passers-by.
Regulation
When one or more plants share a connection point, peak power is an electrical constraint. The SunGuard controller regulates feed-in according to the operator's limits, paired with the dataloggers and, where required, with the CCI. Every action remains tracked.